Frankfurt Airport Operating Direction Forecast
At Frankfurt Airport the wind mainly determines in which direction aircraft take off and land. Shifting winds force an airport-wide change of operating direction; strong northerly wind (e.g. from the Taunus) closes Runway 18. The mission: an ML model that forecasts (1) whether departures on RWY 18 are possible and (2) which operating direction is in use.
- Four runways: two mainly for landings (07L/25R Northwest, 07R/25L South) and two for departures (07C/25C Centre, 18 West).
- The 07/25 runways work both ways, but the operating direction (OD) is airport-wide — when it changes, all runways switch at once. Mixed directions are not possible.
- OD 25: departures and landings towards the west (250°T). OD 07: towards the east (070°T). Runway 18 West: departures to the south (180°T), used in both ODs.
- 01
ML forecast for every hour up to t+48 h: probability of RWY 18 usability, operating direction (25/07), a certainty score and the next probable change time. Applying the rules to a weather forecast was only the baseline — the goal was to beat it.
- 02
Self-sourced data: no dataset is provided. Each team finds and combines suitable public data (e.g. METAR EDDF, weather models, historical operating directions) and cites every source.
- 03
Proven model quality: tested on unseen data, using only information available at forecast time, for 1 h, 6 h and 24 h horizons.
- 04
Submission at day's end: a code repository, a one-page model card and forecasts for the jury test days — compared against the operating directions actually flown.
From rulebook to forecast
The first step was to decompose the problem cleanly. We modelled it as two coupled predictions: the operating direction (07/25) as a classification and the usability of Runway 18 as a probability — both hourly across the full horizon. The physical rules from the case (tailwind and crosswind components) became the deterministic baseline every learned model had to beat.
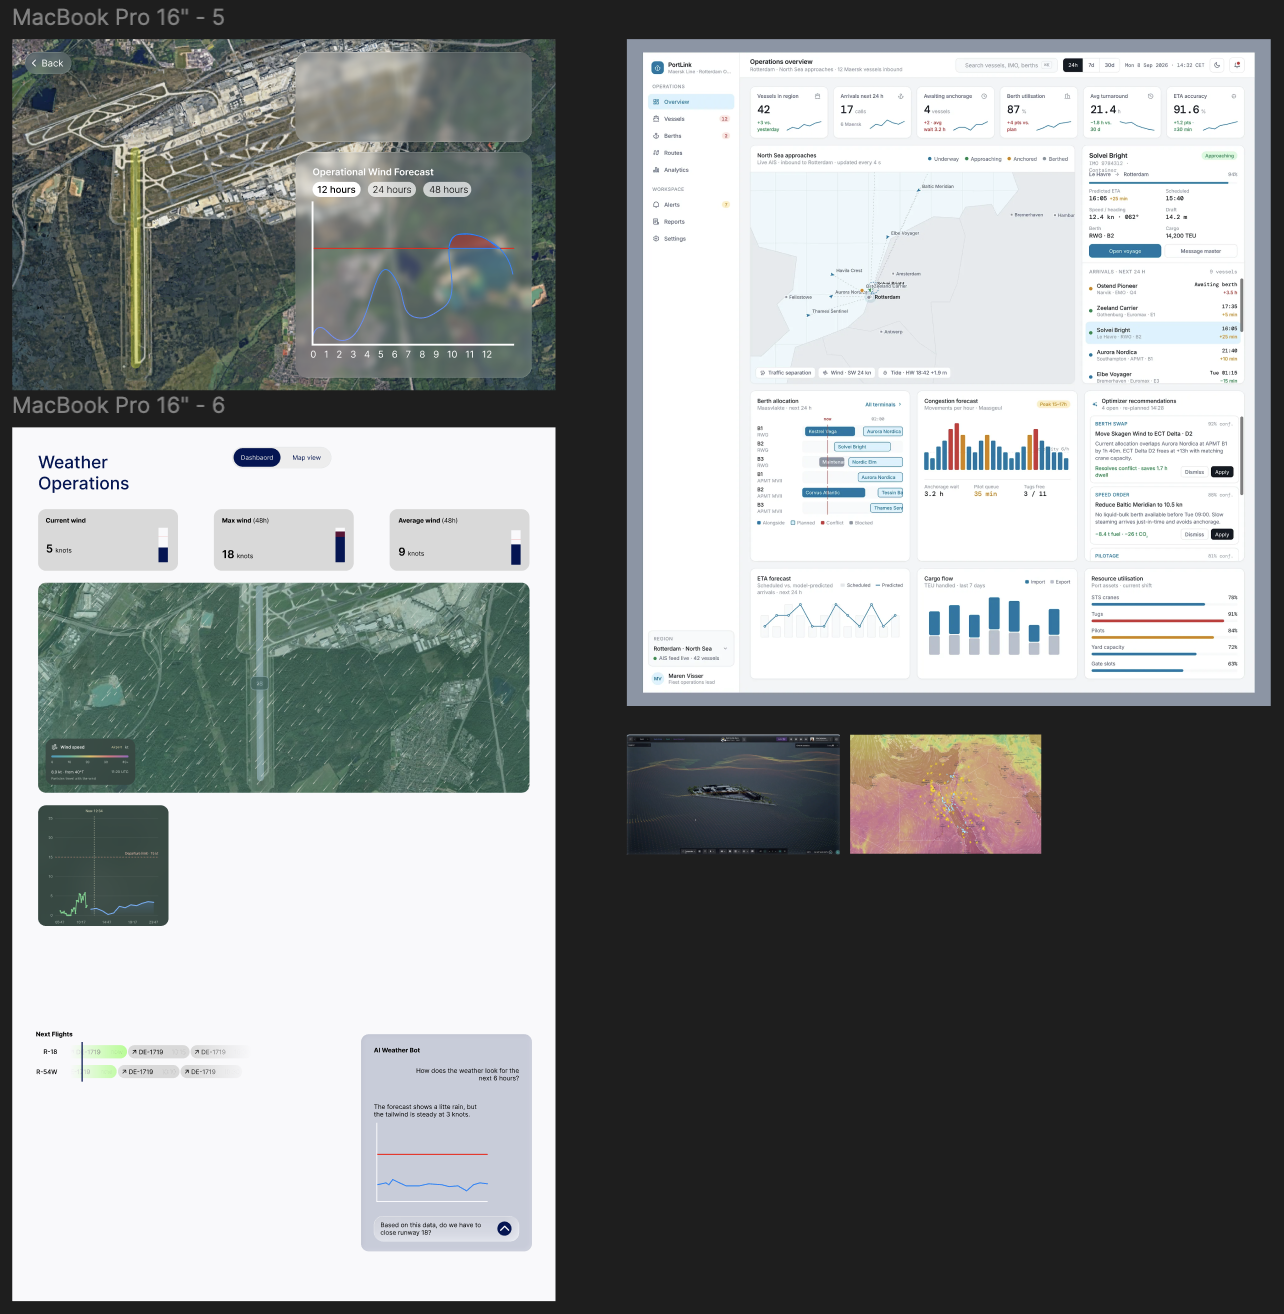
Alongside the model we sketched in Figma how the forecast has to look so it reads at a glance: references from real operations centres, first frames for the map and dashboard — all on one canvas, so the direction and the product grew together.
Data, features, model, test
In plain terms: we turn weather into the few physical numbers that decide Frankfurt's direction, let a model learn the rest, and output an hourly forecast anyone can act on.
Live airport weather (METAR EDDF), weather-model forecasts, and the operating directions the airport actually flew in the past.
For every runway we compute the tailwind and crosswind components — the exact quantities that decide which way the airport operates.
On top of the physics, a model learns what the rules alone miss: forecast uncertainty, how long a direction holds, and when a switch is really coming.
For every hour: the operating direction (07 / 25), the chance Runway 18 is usable, a certainty score, and the next likely change.
Beating the baseline
Applying the rules to a weather forecast was the baseline. Our model had to beat it — tested on unseen days, for horizons of 1 h, 6 h and 24 h.
How far ahead of the rule-based baseline we are, at 1, 6 and 24 hours.
The lead the model keeps as the forecast reaches further out — 1 h to 48 h.
The model forecasts the operating direction (07 / 25) and whether Runway 18 stays usable.
The takeaways behind the charts — why the model wins.
- On every horizon the learned model beats the pure rule baseline — by the widest margin where it matters most: further into the future.
- The further the forecast reaches, the larger the lead: the model captures uncertainty and persistence that fixed rules cannot.
- Both predictions — operating direction and Runway 18 usability — stay reliably accurate, not just one of them.
Placeholder values — real benchmark numbers to follow.
A forecast you can read
The result isn't a black-box score but a clear forecast: per hour the operating direction, the probability for Runway 18, a certainty score and the next probable change time — ready to use for planning.
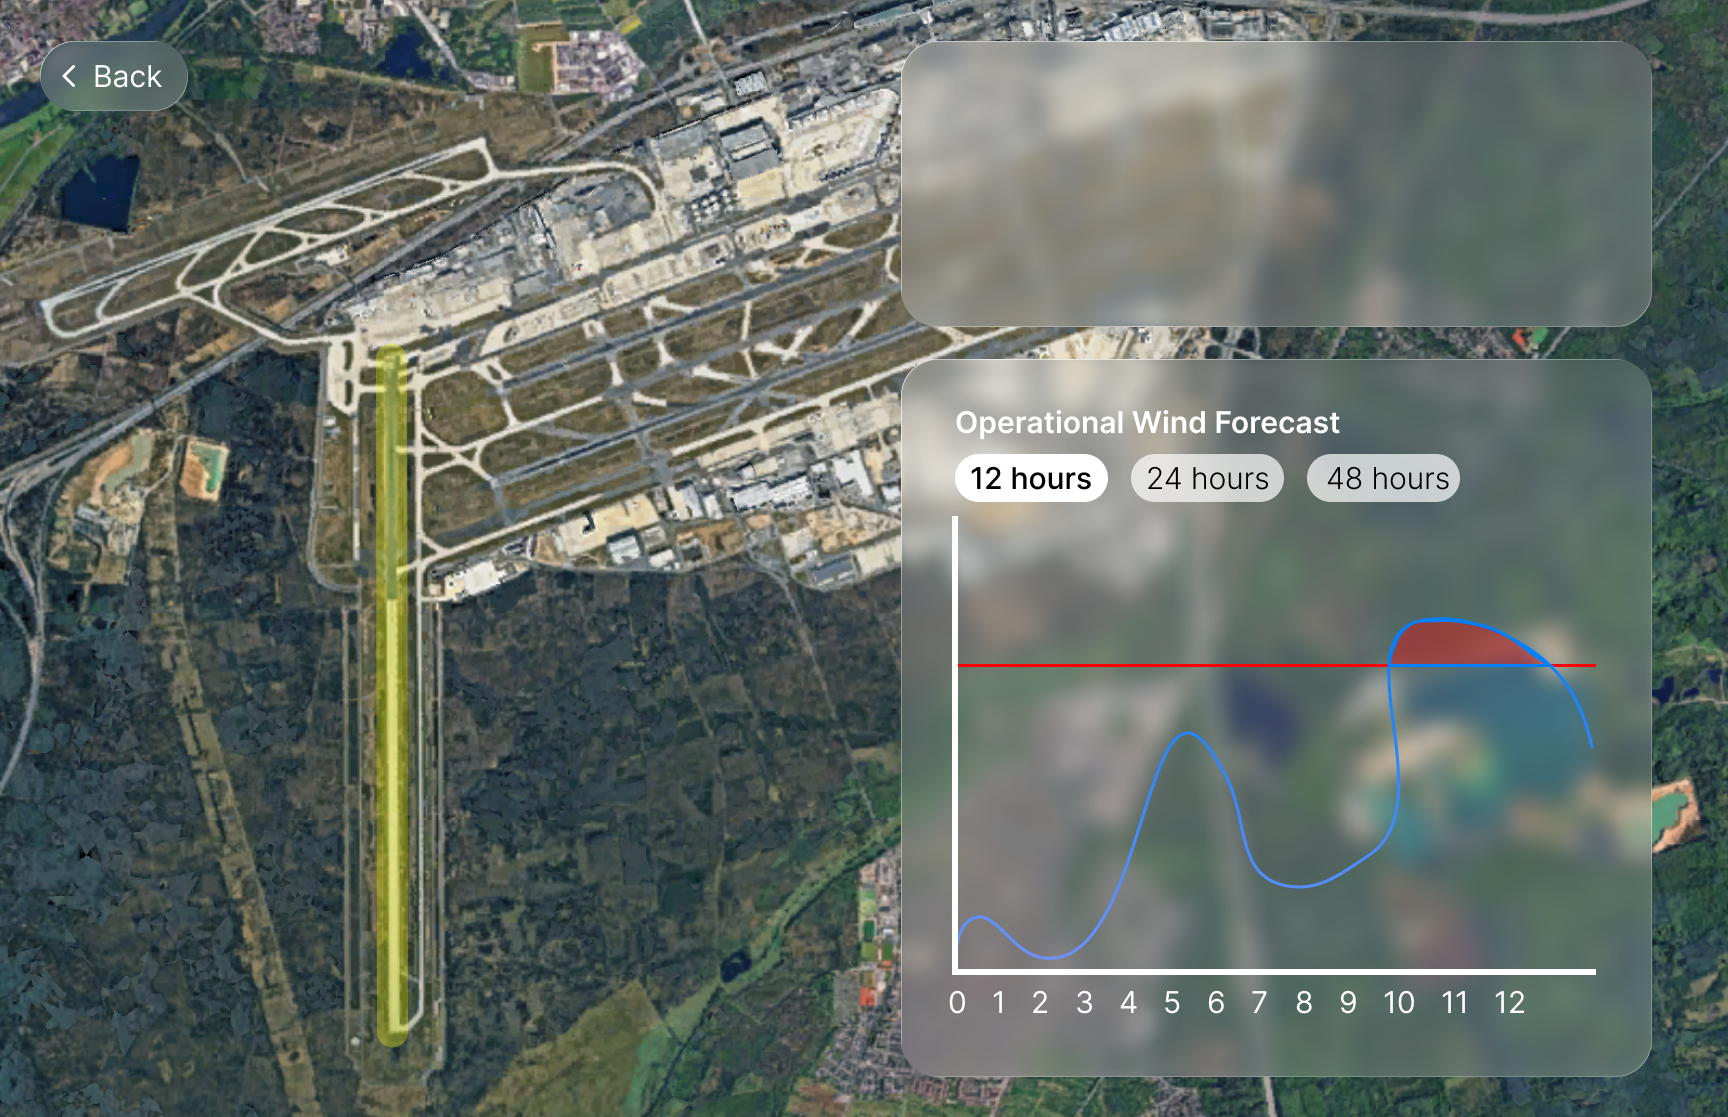
Map view: Runway 18 highlighted, with the operational wind forecast for the next 12 / 24 / 48 hours.
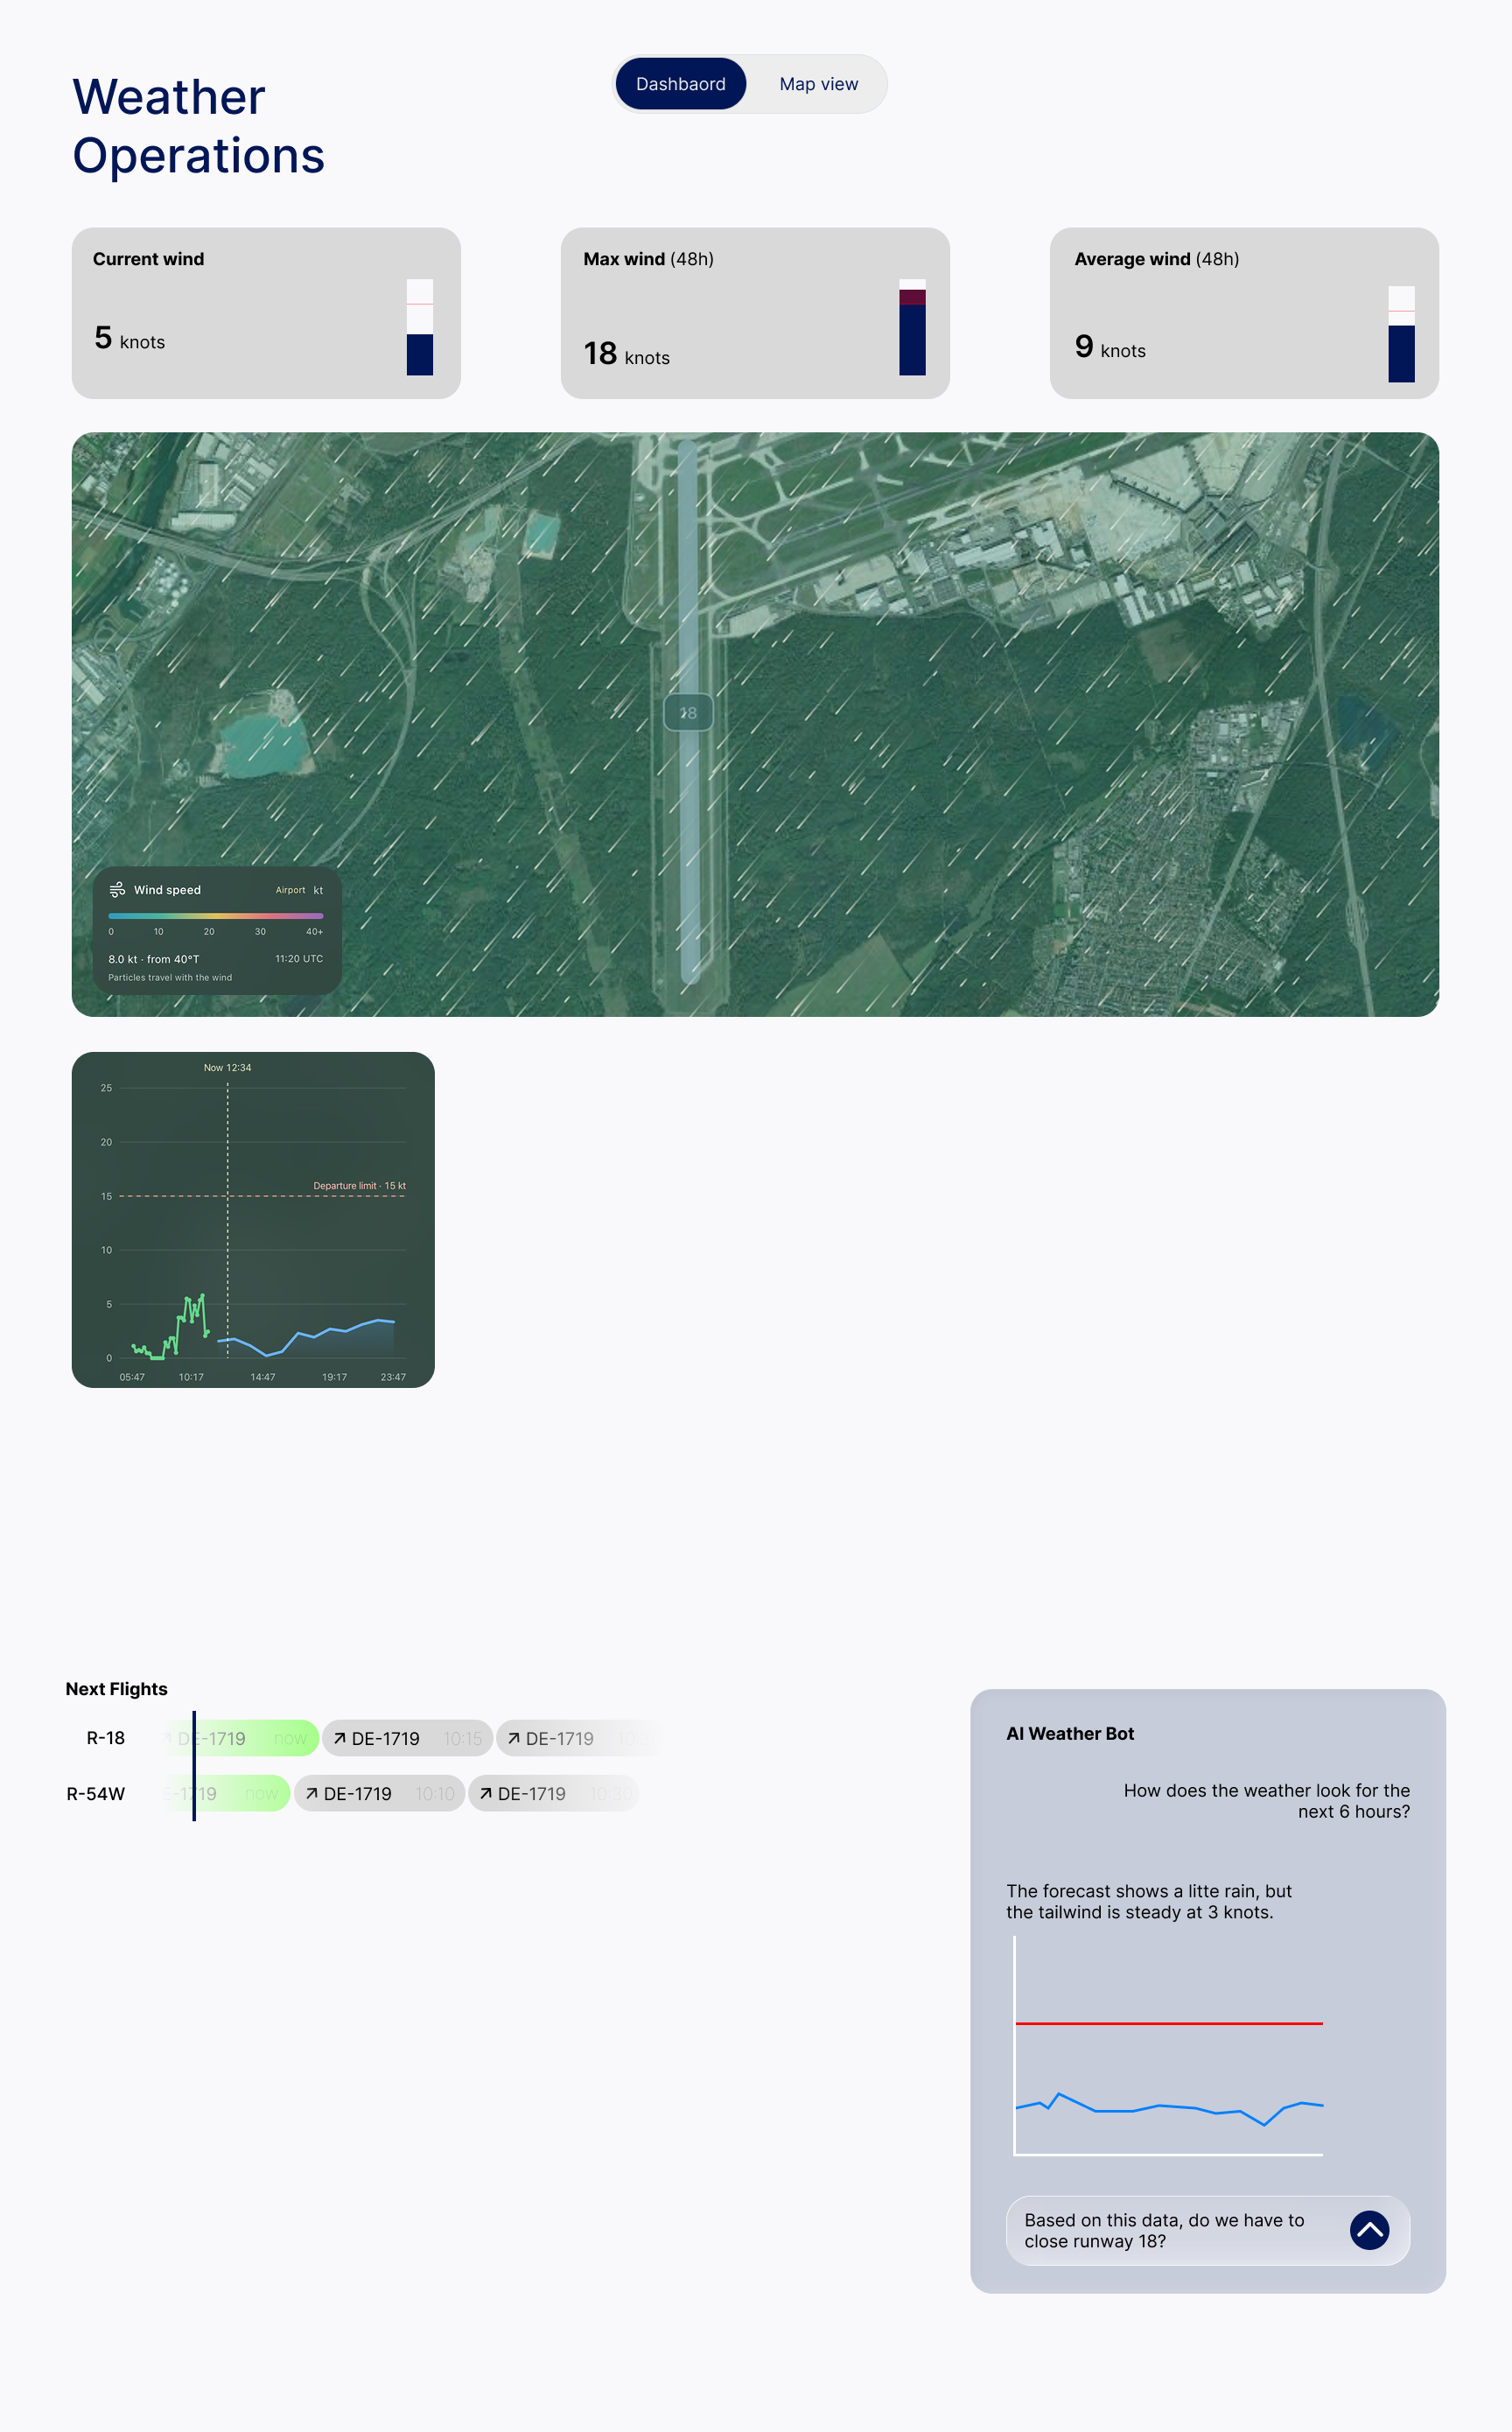
- A map view that shows exactly which runway is affected — with the wind forecast overlaid for 12, 24 and 48 hours.
- An operations dashboard with current, max and average wind, a live wind field and the 15-kt departure limit drawn right on the timeline.
- A plain-language assistant that answers the one question that matters on the day: do we have to close Runway 18?
The pitch to the jury
At the end of the day we presented the case, the model and the results to the jury — and won the FraAlliance case.


This is exactly how we build — for you, too.
One day for the airport, weeks for your product: custom software and deep automation that takes real work off your plate.
Meet pencilrec →